Open-source mobile DevOps #2 - Analyze your mobile application

What is mobile Devops ? There is no denying that native mobile developement is strongly UX focused. UX is a mix between app architecture choices and user interface choices requirering designer,developer, business, client feedbacks in order to tell the right story to the final user. This reality requires a lots of iterations for creating an app. Definitly a mobile continuous integration platform could realy helps you to stay focus and avoid unescessary complexity for testing, checking, validating, distributing a mobile application.
Why I choose an open source approach ?
First I wanted to mastered the whole platform and don’t have a black box as CI system. Mobile tools for OS support, testing, metrics, signature tools… change quickly and the best way to not be stuck by tools requirements is to keep control over the hole chain
Secondly, I considered at the begining of the project that all dedicated mobile forge where limited or costs too much for my needs (2017 research). Perhaps now it is a good thing to benchmark solutions like Bitrise, Microsoft AppCenter that are focusing on a delivering CI management platform on the cloud fully dedicated to mobile apps.
And finally the open source approach completely fits with my actuals CI ecosystem mainly jenkins, gitlab-ci based, most of my company CI tools are open source
The global architecture
We will now focus on quality of your sourcecode and binary delivery. Mobile ecosystem have thousands of tools able to be integrated to your continuous integration. The idea here is not to integrate everything to your gitlab platform but at least to be aware tools families and try to integrate at least one example on each.
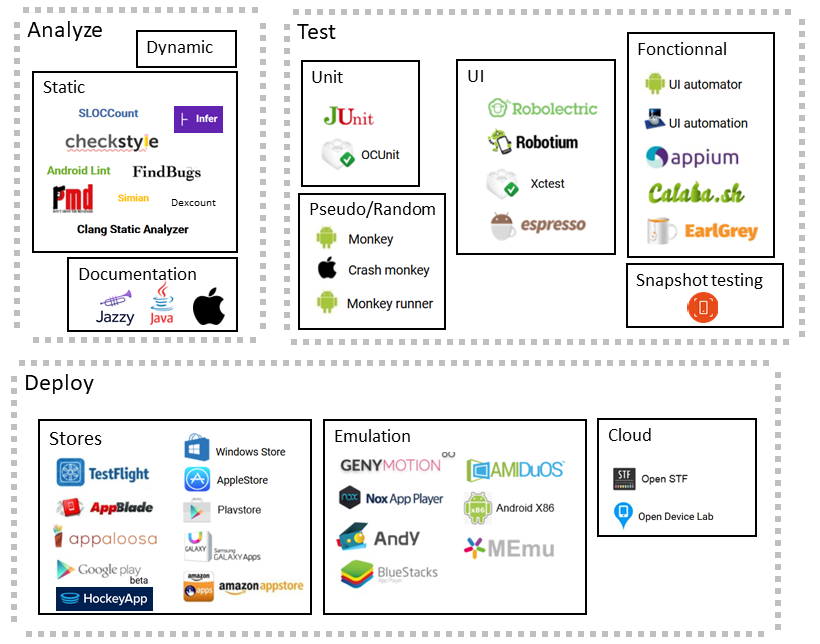
Globally we have 3 main families of tools when we talk about mobile quality :
- Analysing tools : related to search for bugs, functional problems before building and package your app
- Testing tools : related to evaluate your app or part of your app by simulating real conditions
- Deployment tools : deport your testing part on the cloud or by doing manual testing in real conditions after your app is packaged
Part 2 Analyse a mobile application
Static
Static code analysis is done without executing any of the code. It is adequate for understanding security issues within program code and can usually pick up about 85% of the flaws in the code.
- For Android we will integrate Android Lint, PMD, CheckStyle,Findbugs,DexCount, Infer and APK analyser
- For iOS we will integrate Swiftlint
Android Lint

The Lint tool checks your Android project source files for potential bugs and optimization improvements for correctness, security, performance, usability, accessibility, and internationalization. You can run Lint from the command-line or from Android Studio. Android Lint is a part android sdk.
If your project includes build variants, you can use the Gradle wrapper to invoke the lint task for all your variants by entering one of the following commands from the root directory of your project:
    gradlew lint         #  Windows:
    ./gradlew lint       #  Linux or Mac:
    gradlew lintDebug    #  lint task for only a specific build variant, you must capitalize the variant name and prefix it with lint
Dexcount
A Gradle plugin to report the number of method references in your APK or AAR on every build. This helps you keep tabs on the growth of your app, with an eye to staying under the 65,536 method-reference limit, and avoiding the headache of eliminating methods or enabling multidex.
1. Usage
Build.gradle
buildscript {
    repositories {
       mavenCentral() // or jcenter()
   }

 dependencies {
      classpath 'com.getkeepsafe.dexcount:dexcount-gradle-plugin:0.6.1'
  }
}
2. Configuration
// Dexcount plugin
apply plugin: 'com.getkeepsafe.dexcount'

dexcount {

    format = "list"       // The format of the method count output, either “list”, “tree”, “json”, or “yaml”.
    includeClasses = false   // When true, individual classes will be include in the package list - otherwise, only packages are included.
    includeFieldCount = true  // When true, the number of fields in a package or class will be included in the printed output.
    includeTotalMethodCount = false // When true, the total number of methods in the application will be included in the printed output.
    orderByMethodCount = false    // When true, packages will be sorted in descending order by the number of methods they contain
    verbose = false     // When true, the output file will also be printed to the build’s standard output.
    maxTreeDepth = Integer.MAX_VALUE  // Sets the max number of package segments in the output - i.e. when set to 2, counts stop at com.google, when set to 3 you get com.google.android, etc. “Unlimited” by default.
    teamCityIntegration = false // When true, Team City integration strings will be printed.
    enableForInstantRun = false  //When true, count methods even for Instant Run builds. False by default.
}
On your .gitlab-ci.yml
script:
    - chmod 755 gradlew                   # admin permission
    - ./gradlew assemble${Environment}Debug     # shell command  (Environment - PROD,STG,DEV)

artifacts:
     paths:
     - app/build/outputs/dexcount/${Environment}Debug.txt   # Dex Count File Path
     name: "$CI_BUILD_NAME $(date +%F)"        # Download file name 'quality_2017-01-13.zip'
Findbug

A program which uses static analysis to look for bugs in Java code Potential errors are classified in four ranks:
- Scariest
- Scary
- Troubling
- Concern
Note : FindBugs operates on Java bytecode, rather than source code.
// Dexcount plugin
apply plugin: 'findbugs'

task findbugs(type: FindBugs) {

	ignoreFailures = true       // Don't fail the gradle build if a test is failing
    effort = "max"              //The analysis effort level. The value specified should be one of min, default, or max. Higher levels increase precision and find more bugs at the expense of running time and memory consumption.
    reportLevel = "low"         //The priority threshold for reporting bugs. If set to low, all bugs are reported. If set to medium (the default), medium and high priority bugs are reported. If set to high, only high priority bugs are reported.
    classes = files("$project.buildDir/intermediates/classes")      //files on which rule applied

	excludeFilter = file("$rootProject.rootDir/findbug-exclude.xml")    //The filename of a filter specifying bugs to exclude from being reported.

	source = fileTree('src/main/java/')              //The source sets to be analyzed as part of the check and build tasks.
    classpath = files()

    // Customizing the HTML report
    reports {
        xml.enabled = false
        xml.withMessages = true
		xml.destination "$project.buildDir/reports/findbugs/findbugs.xml"
        html.enabled = true
        html.destination "$project.buildDir/reports/findbugs/findbugs.html"
    }
}
findbug-exclude.xml - Ignore warnings about field names in R and manifest file
in your gitlab-ci.yml
script:
    - chmod 755 gradlew                   # admin permission
    - ./gradlew findbug                   # shell command  findbug - task name

artifacts:
     paths:
     - app/build/reports/findbugs/findbugs.html   # File Path
     name: "$CI_BUILD_NAME $(date +%F)"        # Download file name 'quality_2017-01-13.zip'
PMD

PMD is a source code analyzer. It finds common programming flaws like unused variables, empty catch blocks, unnecessary object creation, and so forth. It supports Java, JavaScript, Salesforce.com Apex and Visualforce, PLSQL, Apache Velocity, XML, XSL.
// PMD plugin

apply plugin: 'pmd'                    // plugin adds a number of tasks to the project that perform the quality checks

task pmd (type: Pmd) {
	ignoreFailures = true              // Whether or not to allow the build to continue if there are warnings. Example: ignoreFailures = true
    description 'Run pmd'
    group 'verification'
    ruleSets = ["java-basic", "java-braces", "java-strings", "java-design", "java-unusedcode"]  //The built-in rule sets to be used. See the official list of built-in rule sets. Example: ruleSets = ["basic", "braces"]
    source = fileTree('src/main/java')  //The source sets to be analyzed as part of the check and build tasks.
    // Customizing the HTML report
    reports {
        xml.enabled = true
        html.enabled = true
    }
}
in your .gitlab-ci.yml
script:
    - chmod 755 gradlew                   # admin permission
    - ./gradlew pmd                       # shell command  pmd - task name

artifacts:
     paths:
     - app/build/reports/pmd/pmd.html          # File Path
     name: "$CI_BUILD_NAME $(date +%F)"        # Download file name 'quality_2017-01-13.zip'
CheckStyle

Checkstyle is highly configurable and can be made to support almost any coding standard. Checkstyle to make sure that everyone in the team write code in a similar maner.
// checkstyle plugin
apply plugin: 'checkstyle'                    // plugin adds a number of tasks to the project that perform the quality checks

task checkstyle(type: Checkstyle) {

    configFile = rootProject.file('checkstyle.xml')                        //rules set
	source "src/main/java"
	include "**/*.java"
	exclude "**/gen/**"
	ignoreFailures = true
	classpath = files()
}
checkstyle.xml - It contains all the rule set
in your *gitlab-ci.yml
script:
    - chmod 755 gradlew                   # admin permission
    - ./gradlew checkstyle                # shell command  checkstyle - task name

artifacts:
     paths:
     - app/build/reports/checkstyle/checkstyle.html         # File Path
     name: "$CI_BUILD_NAME $(date +%F)"        # Download file name 'quality_2017-01-13.zip'
Apk analyser

apkanalyzer is included in the Android SDK Tools package and located at android_sdk/tools/bin/apkanalyzer. Alternatively, you can access the APK Analyzer tool within Android Studio as described in Analyze Your Build with APK Analyzer.
Syntax
apkanalyzer [global-options] subject verb [options] apk-file [apk-file2]
The subject is what you want to query and can be the entire APK or a part of the APK. A subject can be any one of the following.
- apk: Analyze APK file attributes such as application ID, version code, and version name.
- files: Analyze the files inside the APK file.
- manifest: Analyze the contents of the manifest inside the APK file.
- dex: Analyze the DEX files inside the APK file.
- resources: View text, image, and string resources.
In .gitlab-ci.yml
apk-analyser:
    stage: apk-analyser                                              # 4. distribution stage
    environment: DEV                                                 # environment: DEVELOPMENT
    tags:
     - android-docker                                                # docker image
    script:
    - chmod 755 gradlew
    - ./gradlew assembleDEVDebug
    - chmod 755 analyser.sh
    - ./analyser.sh $APK_PATH
    - touch app/build/outputs/apk/DEV/debug/analyser.txt
    - ./analyser.sh $APK_PATH >> app/build/outputs/apk/DEV/debug/analyser.txt
    variables:
      APK_PATH: "app/build/outputs/apk/DEV/debug/app-DEV-debug.apk"            # apk path
    artifacts:
      paths:
      - app/build/outputs/apk/DEV/debug
      name: "sample-android-$CI_BUILD_NAME $(date +%F)"
      expire_in: 1 month
Analyser shell script file
#!/usr/bin/bash -ex

path=$APK_PATH

echo analyzing apk file...

/usr/local/android-sdk-linux/tools/bin/apkanalyzer -h apk file-size $path
/usr/local/android-sdk-linux/tools/bin/apkanalyzer -h apk summary $path
/usr/local/android-sdk-linux/tools/bin/apkanalyzer -h files list $path
/usr/local/android-sdk-linux/tools/bin/apkanalyzer -h manifest min-sdk $path
/usr/local/android-sdk-linux/tools/bin/apkanalyzer -h manifest target-sdk $path
/usr/local/android-sdk-linux/tools/bin/apkanalyzer -h manifest permissions $path
/usr/local/android-sdk-linux/tools/bin/apkanalyzer -h dex list $path
/usr/local/android-sdk-linux/tools/bin/apkanalyzer -h resources packages $path
Analyser shell script file output
analyzing apk file...
apk file-size!
1.8MB
apk summary!
com.myapp.app	5	1.1.1
files list!
/resources.arsc
/res/
/res/xml/
/res/xml/fullbackupcontent.xml
/res/mipmap-xxxhdpi-v4/
/res/layout/
/res/drawable/
/res/color/
/res/animator-v21/
/res/anim/
/classes.dex
/META-INF/
/META-INF/com.android.support_transition.version
/META-INF/CERT.RSA
/AndroidManifest.xml
manifest min-sdk!
14
manifest target-sdk!
27
manifest permissions!
dex list!
classes.dex
resources packages!
com.myapp.app
Infer

Infer is a static analysis tool - if you give Infer some Java or C/C++/Objective-C code it produces a list of potential bugs. Anyone can use Infer to intercept critical bugs before they have shipped to users, and help prevent crashes or poor performance.
To use Infer in gitlab-ci.yml file with gradle task simple put line in to:
infer run -- gradle some_task
To use Infer with gradle wrapper you can use command :
infer run -- ./gradlew some_task
Software projects such as mobile apps use incremental build systems, where code evolves as a sequence of code changes. For these projects, it can often make sense to analyze only the current changes in the project, instead of analyzing the whole project every time. It is possible to analyze only what’s changed using Infer’s reactive mode.
infer run --reactive -- ./gradlew some_task
or just use -r option
You can use infer with eradicate analyzer which give you more information about your code. Please find more info about here
All information about finding problems in your code are in reports files infer-out/* which you can push to gitlab as Artifacts, for example:
 artifacts:
      paths:
      - infer-out/*
just add this code to your gitlab-ci.yml file and all files from infer-out/ catalog will be exported .
SwiftLint

The quality checks could be done by using swiftlint for iOS apps It is used to enforce Swift style and conventions, loosely based on GitHub’s Swift Style Guide. SwiftLint hooks into Clang and SourceKit to use the AST representation of your source files for more accurate results.
swiftlint lint --reporter html > swiftlint.html || true
Dynamic
Dynamic code analysis relies on studying how the code behaves during execution. It has the additional ability to find security issues caused by the code’s interaction with other system components
We will not go too deeper on this topic (perhaps on another post :-)) but mainly you can use reverse enginering tools to check your obfuscation configuration, challenge also injections of codes. For Android you can also automate the process with command line tools such as Dex to Java decompiler
Documentation
Documentation for the functional quality is also crutial and can helps you to see bad architectured part of you application
- For Android we will the JavaDoc and Dokka (Kotlin)
- For iOS we will integrate AppleDoc (ObjC) and Jazzy (Swift)
Javadoc
javadoc is a tool which comes with JDK and it is used for generating Java code documentation in HTML format from Java source code, which requires documentation in a predefined format.
/** documentation */ Documentation comment and in general its called doc comment.
The JDK javadoc tool uses doc comments when preparing automatically generated documentation.
Add the following task to your build.gradle file in your project
android.applicationVariants.all { variant ->
    task("generate${variant.name.capitalize()}JavaDoc", type: Javadoc) {
        description "Generates Javadoc for $variant.name."
        source = variant.javaCompile.source
        destinationDir = reporting.file("app-docs")
        ext.androidJar = "${android.sdkDirectory}/platforms/${android.compileSdkVersion}/android.jar"
        classpath = files(variant.javaCompile.classpath.files) + files(ext.androidJar)
    }
}
Java 8 problems
For time when this documentation is writen project is using Java8 . This version of Java making some problems with generationg documentation by javadoc. If you still use Java 8 please add this code before code from previous step.
if (JavaVersion.current().isJava8Compatible()) {
    allprojects {
        tasks.withType(Javadoc) {
            options.addStringOption('Xdoclint:none', '-quiet')
        }
    }
}
reamember add proper plugin for generationg javadoc for this day we do use apply plugin: 'com.android.application'
.gitlab-ci.yml to generate the javadoc
documentation:
    stage: documentation     # stage name
    tags:
     - android-docker        # android docker image tag

    script:
    - ./gradlew generatePRODDebugJavaDoc    # shell command to generate the javadoc. Remember to put proper flavor in to your command (PROD , DEV, STG). In this case we do generating for PROD flavor.
    artifacts:
      paths:
      - app/build/reports/app-docs/*            # generating documentation from this path in your project. You can change this path by changing destinationDir directive in ``build.gradle`` file
      name: "$CI_BUILD_NAME $(date +%F)" # name of the artifacts
Jazzy (Swift)

jazzy is a command-line utility that generates documentation for Swift or Objective-C. It is used for generating code documentation in HTML format from source code, which requires documentation in a predefined format.
The jazzy tool uses doc comments when preparing automatically generated documentation.
Basic Header Documentation
A Quick Help comment consists of a either triple line or double-asterisked comments:
/// This is a quick help comment

/**
  And so is this
*/
You can have a look to a sample example here
Integrate to .gitlab-ci.yml
.gitlab-ci.yml to generate the documentation
documentation:
    stage: documentation
    script:
     - jazzy --clean --min-acl private --author $AUTHOR --author_url $AUTHOR_URL --github_url $REPO_URL --module-version $VERSION  --xcodebuild-arguments $XCODE_ARGUMENTS  --output $DOCUMENTATION --no-skip-undocumented --module $MODULE_NAME
    variables:
      AUTHOR: "author"
      AUTHOR_URL: "https://xxx"
      REPO_URL: "https://gitlab.com/xxxx"
      VERSION: "0.1"
      XCODE_ARGUMENTS: "-scheme,myscheme"
      DOCUMENTATION: "build/documentation"
      MODULE_NAME: "myIosModule"
    artifacts:
      paths:
      - build/documentation/*
      name: "jazzy_documentation"
      expire_in: 1 month
    tags:
      - xcode
AppleDoc (ObjectiveC)
Appledoc is command line tool that helps Objective-C developers generate Apple-like source code documentation from specially formatted source code comments. It’s designed to take as readable source code comments as possible for the input and use comments as well as surrounding source code to generate visually appealing documentation in the form of HTML as well as fully indexed and browsable Xcode documentation set.
You can find an example of YML below :
documentation:
   stage: documentation
   script:
    - /usr/local/bin/appledoc --print-settings --verbose 3 --output "build/Documentation" --project-name "project name" --project-company "mycompagny" --no-create-docset --keep-undocumented-objects --keep-undocumented-members --keep-intermediate-files --no-repeat-first-par --no-warn-undocumented-object --no-warn-undocumented-member --no-warn-empty-description --no-warn-unknown-directive  --no-warn-missing-arg  --exit-threshold 2 --no-warn-invalid-crossref --create-html .
   artifacts:
    paths:
     - build/Documentation/*
    name: "com.mypackage.*"
    expire_in: 1 month
   tags:
     - xcode
Conclusion
You are now able to mastered a descent analysing step before releasing your app, retrieving metrics regarding your language semantic, platform best practices, and functionnal coherence. Of course this implementation could have meaning only if you are fully integrating it on your project lifecycle. For exemple making a full review of metrics after each agile Sprint to ensure quality of your app. Gitlab could help also by using a specific branch, merge requests …
That’s all for today !
The project can be forked here